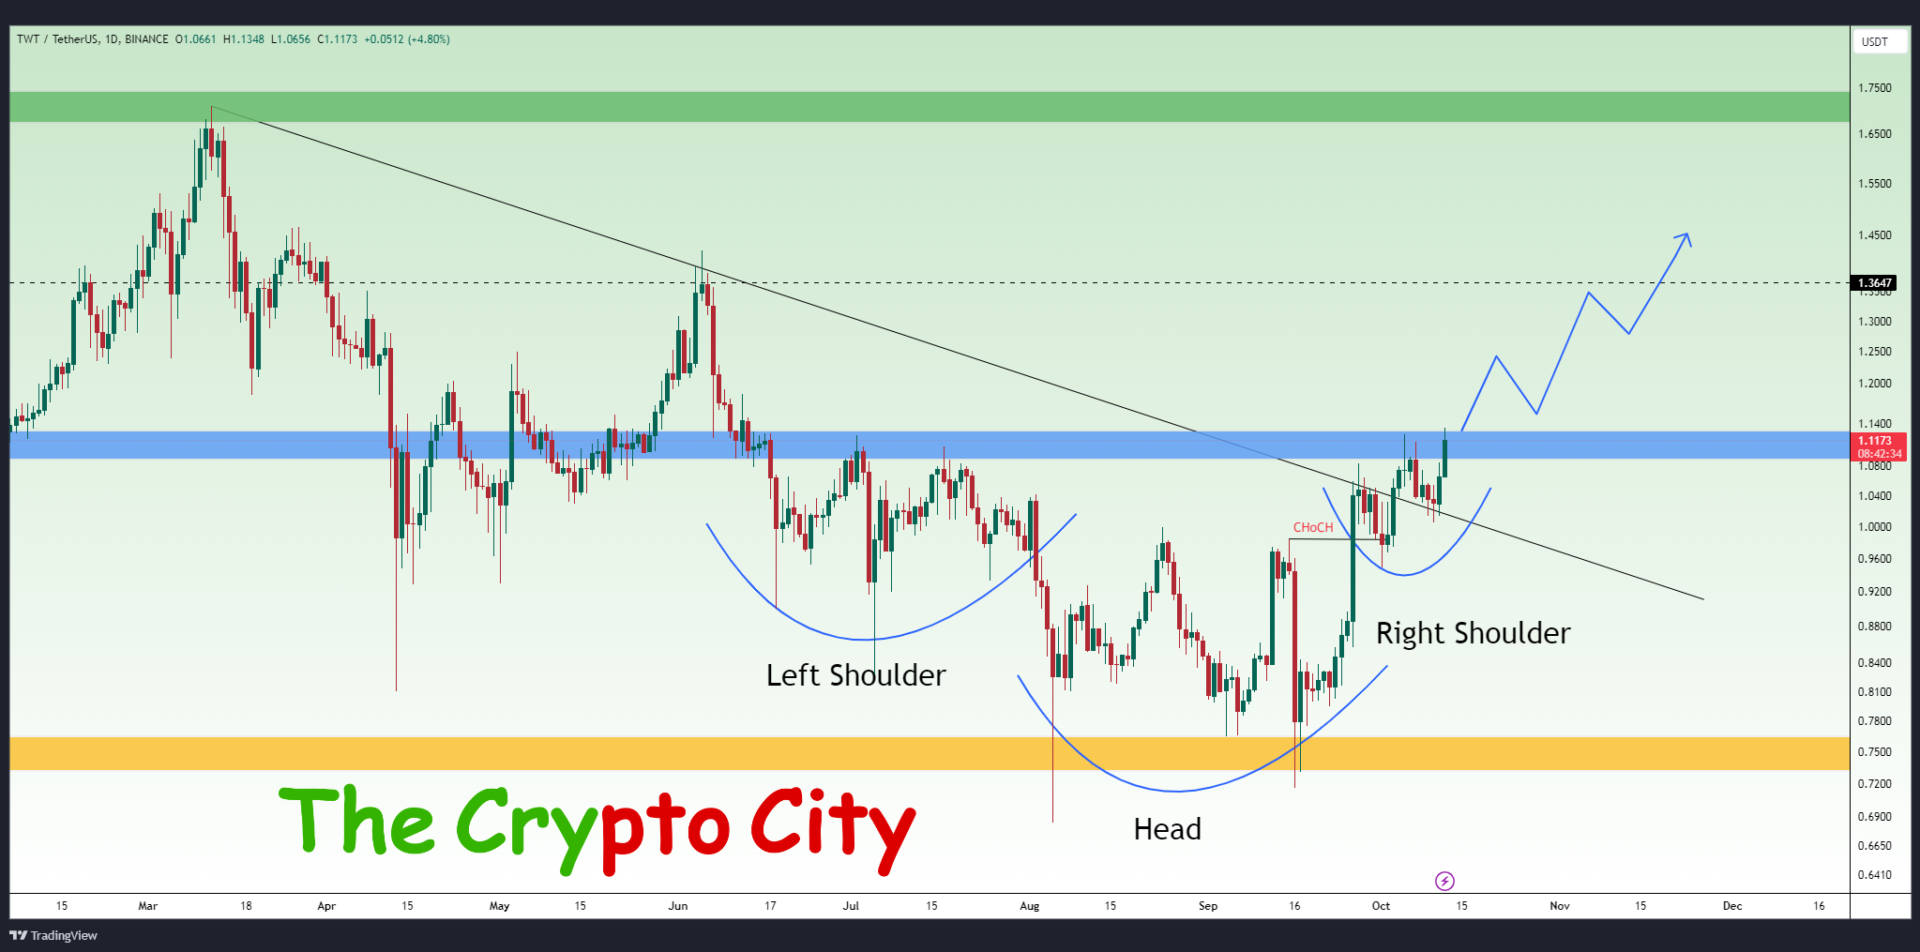
TWT USDT Bullish Potential: Breakout Confirmation Could Trigger Big Gains
TWT USDT is showing signs of bullish momentum after forming a double bottom and breaking out of a resistant trendline. Currently we’re seeing the formation of an inverse head and shoulders pattern just below the resistance zone—an interesting development that could hint at a bullish continuation.
If TWT USDT breaks out of the resistance zone in Blue and closes a candle above it, this would significantly increase the probability of a bullish move. Watch for that confirmation!
In the event of a fall, we would expect a bounce from the support zone yellow. However, to strengthen the bullish case, it would be better to wait for an I-CHoCH (Internal Change of Character) signaling a return to the bullish market structure. This would put the probability back in our favor.
A breakdown and candle closing below the support zone Yellow would invalidate our entire bullish outlook.
We also provide multiple trading setups in our premium discord server, you can take great benefit from it.


