Riding the Bull: A Technical Analysis of DOT/USDT’s Upward Momentum
Introduction:
Cryptocurrency markets are dynamic and often driven by complex factors. One such digital asset that has recently caught the attention of traders and investors is DOT/USDT. In this blog, we’ll delve into a technical analysis of the DOT/USDT pair to understand its recent bullish momentum and potential future movements.

Analyzing the Price Action:
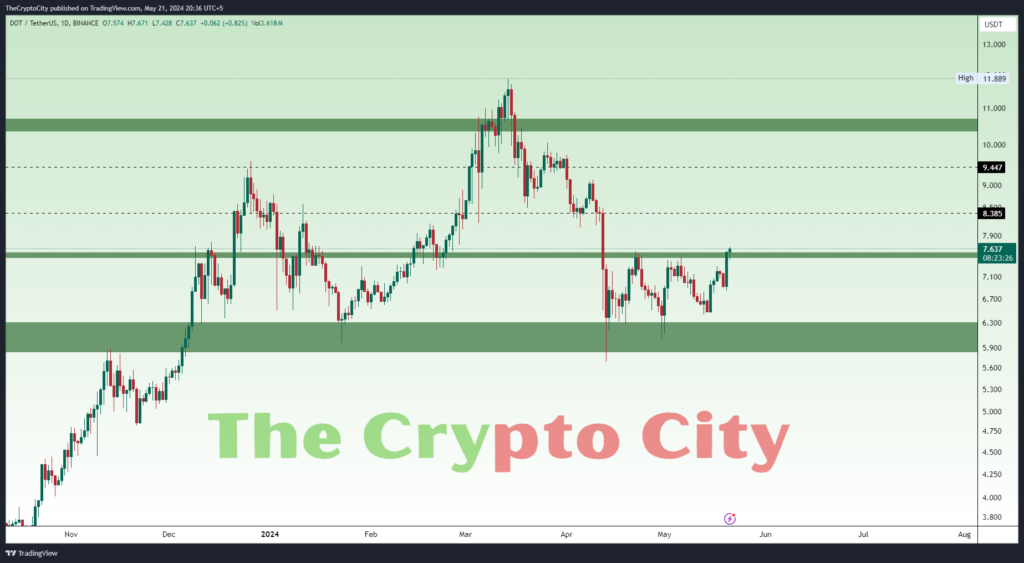
The daily chart for DOT/USDT reveals a significant bullish momentum. The price has surged to approximately 7.67 USDT, breaking through a key resistance level at around 7.579 USDT. This upward movement signifies the potential for continued gains in the near future.
Historical Performance:
To gain a deeper insight, let’s look back at the historical performance of DOT/USDT. From late 2023 to early 2024, the asset exhibited a robust rally, peaking near 11.89 USDT before experiencing a sharp correction. Interestingly, this correction found support around the 6.00 USDT mark, indicating a strong foundational level for the asset.
Key Breakout and Resistance Levels:
The current breakout above the 7.579 USDT resistance level is a critical signal, suggesting that buyers are regaining control of the market. The next significant resistance level lies at 8.385 USDT, which coincides with previous consolidation areas observed in early 2024.
Potential Targets:
If the price manages to sustain above the 8.385 USDT resistance level, it could target higher levels. Specifically, targets around 9.50 USDT and potentially 10.50 USDT are in focus, where strong resistance zones are evident based on historical price action.
Importance of Volume Analysis:
While price movements are crucial, analyzing trading volume is equally essential. Increased trading volume accompanying the recent price rise would validate the strength of the bullish move. Conversely, if the breakout is not supported by substantial volume, it raises the risk of a false breakout, signaling caution to traders and investors.
Conclusion:
In conclusion, the technical analysis of DOT/USDT indicates a significant bullish momentum with the potential for further upside. Breaking through key resistance levels and finding support at crucial points underscores the strength of the current trend. However, traders should remain vigilant and monitor trading volume closely to confirm the sustainability of the bullish momentum. With careful analysis and risk management, traders can navigate the dynamic cryptocurrency markets effectively.

