Detailed Technical Analysis for GALA/USDT Chart
Welcome back to another edition of The Crypto City Trading Newsletter, your go-to source for in-depth technical analysis and expert insights into the dynamic world of cryptocurrency trading. We are focusing on the daily price action of GALA/USDT.
We also provided a signal of GALA in our free premium discord server, you can take great benefit from it, as we posted multiple trading setups there. Join us and reach your financial freedom.
Our Discord Link (https://discord.gg/pYWa2cJC8E)
Now moving towards the analysis.
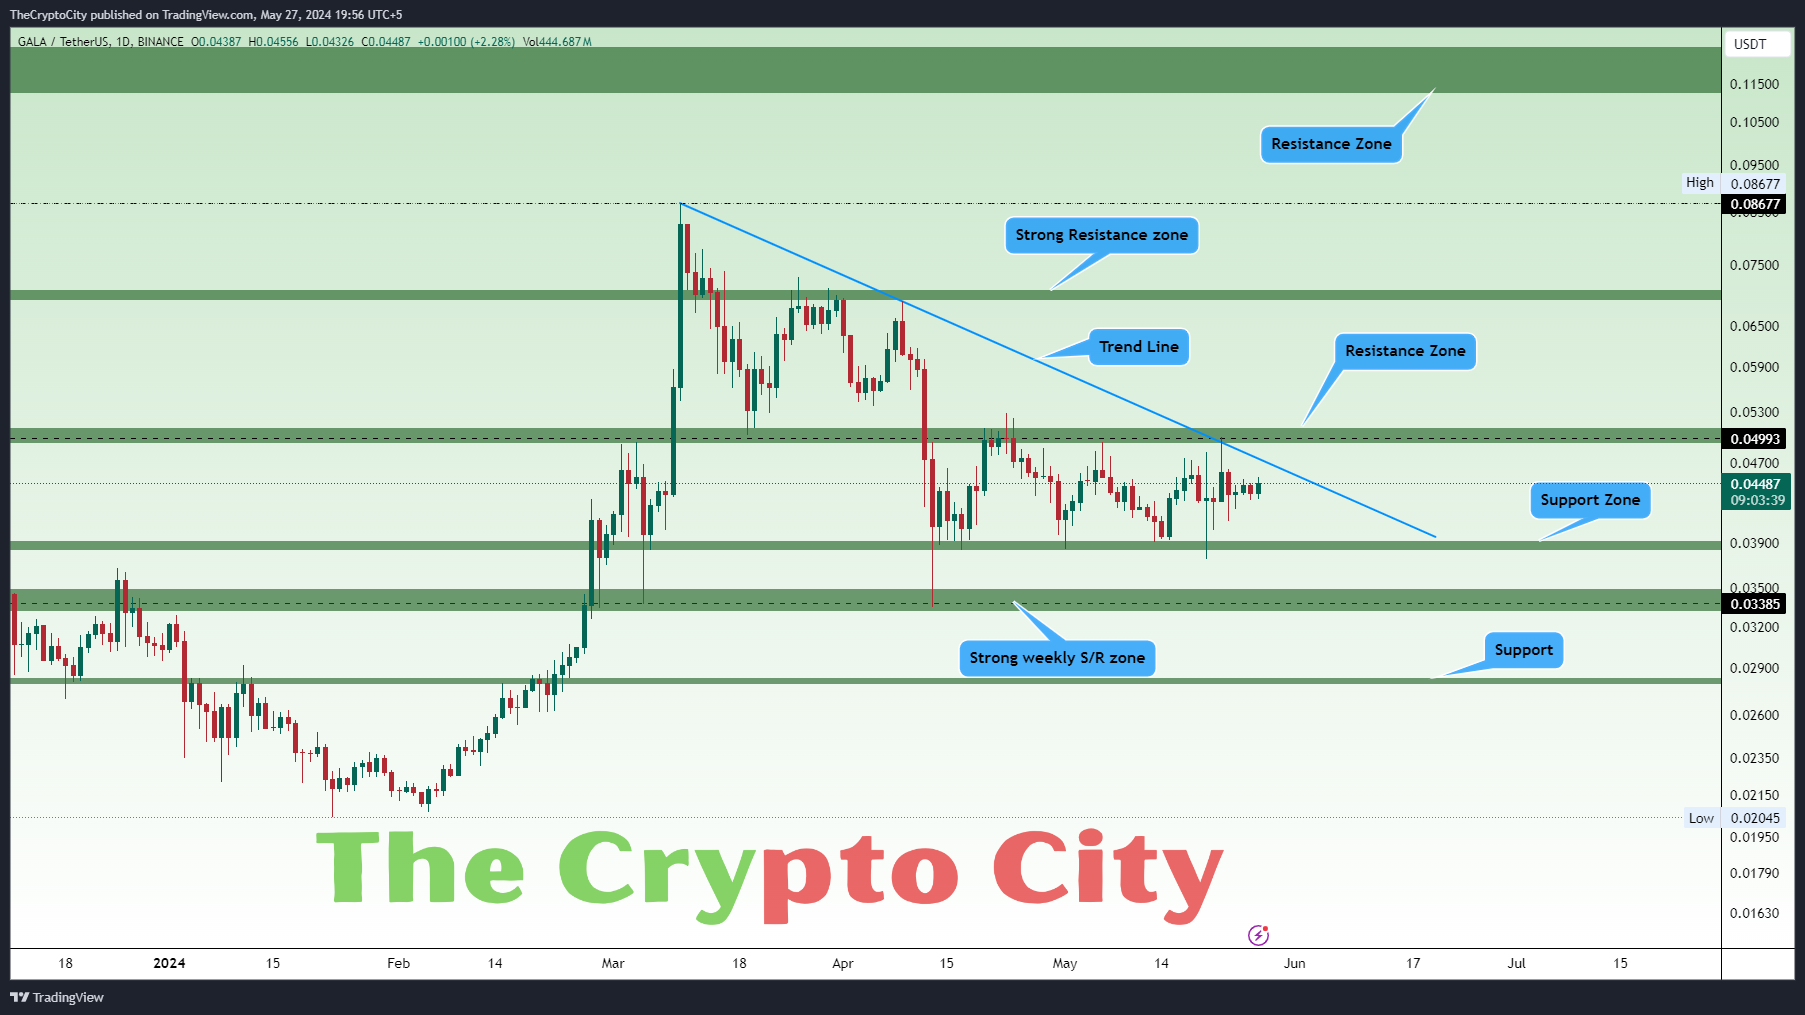
In our daily analysis, GALA is still trading within a defined range, with support at $0.03828 – $0.03928 and a resistance zone at $0.04920 – $0.05124. This range has held for approximately more than 39 days. When the price reached the resistance level at 0.08677, leading to a correction. The decreasing volume during this correction suggests the bullish trend could still have potential. Several key technical elements and zones are marked, providing a comprehensive view of the market’s structure and potential future movements.
Strong Resistance Zone ($0.06882 – $0.07095)
There is a strong resistance zone at $0.06882 – $0.07095. This upper resistance zone is important because historically price bounce back multiple times from this zone. The multiple failed attempts to break above this level indicate a strong hurdle to upward growth.
Trend Line
A descending trend line from the recent highs acts as a dynamic resistance. This trend line is crucial as it defines the current bearish trend. A breakout above this trend line would be an early indicator of a potential trend reversal.
Resistance Zone ($0.04920 – $0.05124)
This resistance zone represents a key level where the price has faced resistance multiple times. Breaking through this level would be critical for the bulls, signaling the possibility of a sustained upward move toward the higher resistance zones. The Price is rejected from here multiple times.
Support Zone ($0.03828 – $0.03928)
This support zone has provided a floor for the price action in recent times. It is a critical level to watch, as a break below this support could lead to further declines. This zone has previously acted as a significant reversal point. Many times price bonuses back from this level.
Strong Weekly Support/Resistance Zone ($0.03313 – $0.03505)
This level acts as a strong support and resistance on the weekly timeframe. Historically, it has provided substantial support during downturns and significant resistance during uptrends. It is a crucial level for the longer-term trend.
Support (~$0.02790 – $0.02839)
This is the lowest support level marked on the chart. We think this support acts as a last line of defense for the Bulls. A breakdown below this level would indicate severe bearish momentum.
Current Price Action
Currently, the price is trading around $0.04401, consolidating within a range bounded by the support zone at $0.02790 – $0.02839 and the resistance zone at $0.03313 – $0.03505. The price is moving sideways, showing indecision among traders as it trades below the descending trend line. The price action is approaching the trend line, indicating a potential test of this dynamic resistance.
Potential Scenarios
We are with a bullish scenario as we posted a buying setup in our discord server. For the sake of this analysis, we have to tell you both the scenarios.
1. Bullish Scenario
In the bullish scenario, if the price breaks above the descending trend line and clears the resistance at $0.03313 – $0.03505, it could signal the start of a bullish trend. The next target would be the strong resistance zone around $0.06882 – $0.07095. Volume confirmation is essential for this scenario. An increase in volume during the breakout would add validity to the bullish move. Candlestick patterns such as bullish engulfing or hammer near support levels can provide additional confirmation for entry points.
2. Bearish Scenario
In the bearish scenario, if the price fails to break above the trend line and falls below the support zone at $0.03828 – $0.03928, it may lead to a decline toward the strong weekly support/resistance zone at $0.03313 – $0.03505. A breakdown below this level would target the support at $0.02790 – $0.02839. This scenario would indicate strong selling pressure and a continuation of the bearish trend. Monitoring volume spikes during declines and bearish candlestick patterns, such as bearish engulfing or shooting star at resistance levels, can help confirm the bearish scenario.
Indicators and Patterns
Volume analysis is critical. Higher volume during upward moves indicates strong buying interest, while higher volume during declines suggests stronger selling pressure. Volume spikes at key levels confirm the strength of breakouts or breakdowns. If bullish reversal patterns like bullish engulfing or hammer at support levels provide strong buy signals. Conversely, bearish reversal patterns like bearish engulfing or shooting star at resistance levels signal potential selling opportunities.
Conclusion
The GALA/USDT chart shows a market in consolidation with clear support and resistance levels. The descending trend line is a critical resistance point that could define the future trend. Traders should watch the price action near these key levels, paying close attention to volume and candlestick patterns for confirmation of potential breakouts or breakdowns. Staying above the support zone and breaking through the resistance could indicate a bullish trend, while failing to hold the support may lead to further declines.
This detailed analysis provides a comprehensive understanding of the current market structure and potential scenarios for GALA/USDT. Traders can use these insights to make informed decisions and effectively navigate the market.
Stay tuned to The Crypto City Trading Newsletter for more in-depth analyses, market insights, and expert guidance. As always, we strive to empower you with the knowledge and tools needed to navigate the fast-paced world of cryptocurrency trading. Happy trading!
Thank you for being a valued subscriber. We hope you find our insights helpful and informative. For more detailed analysis and updates, visit our website or follow us on social media.
Warm regards,
The Crypto City Trading Team

