CHR Technical Analysis
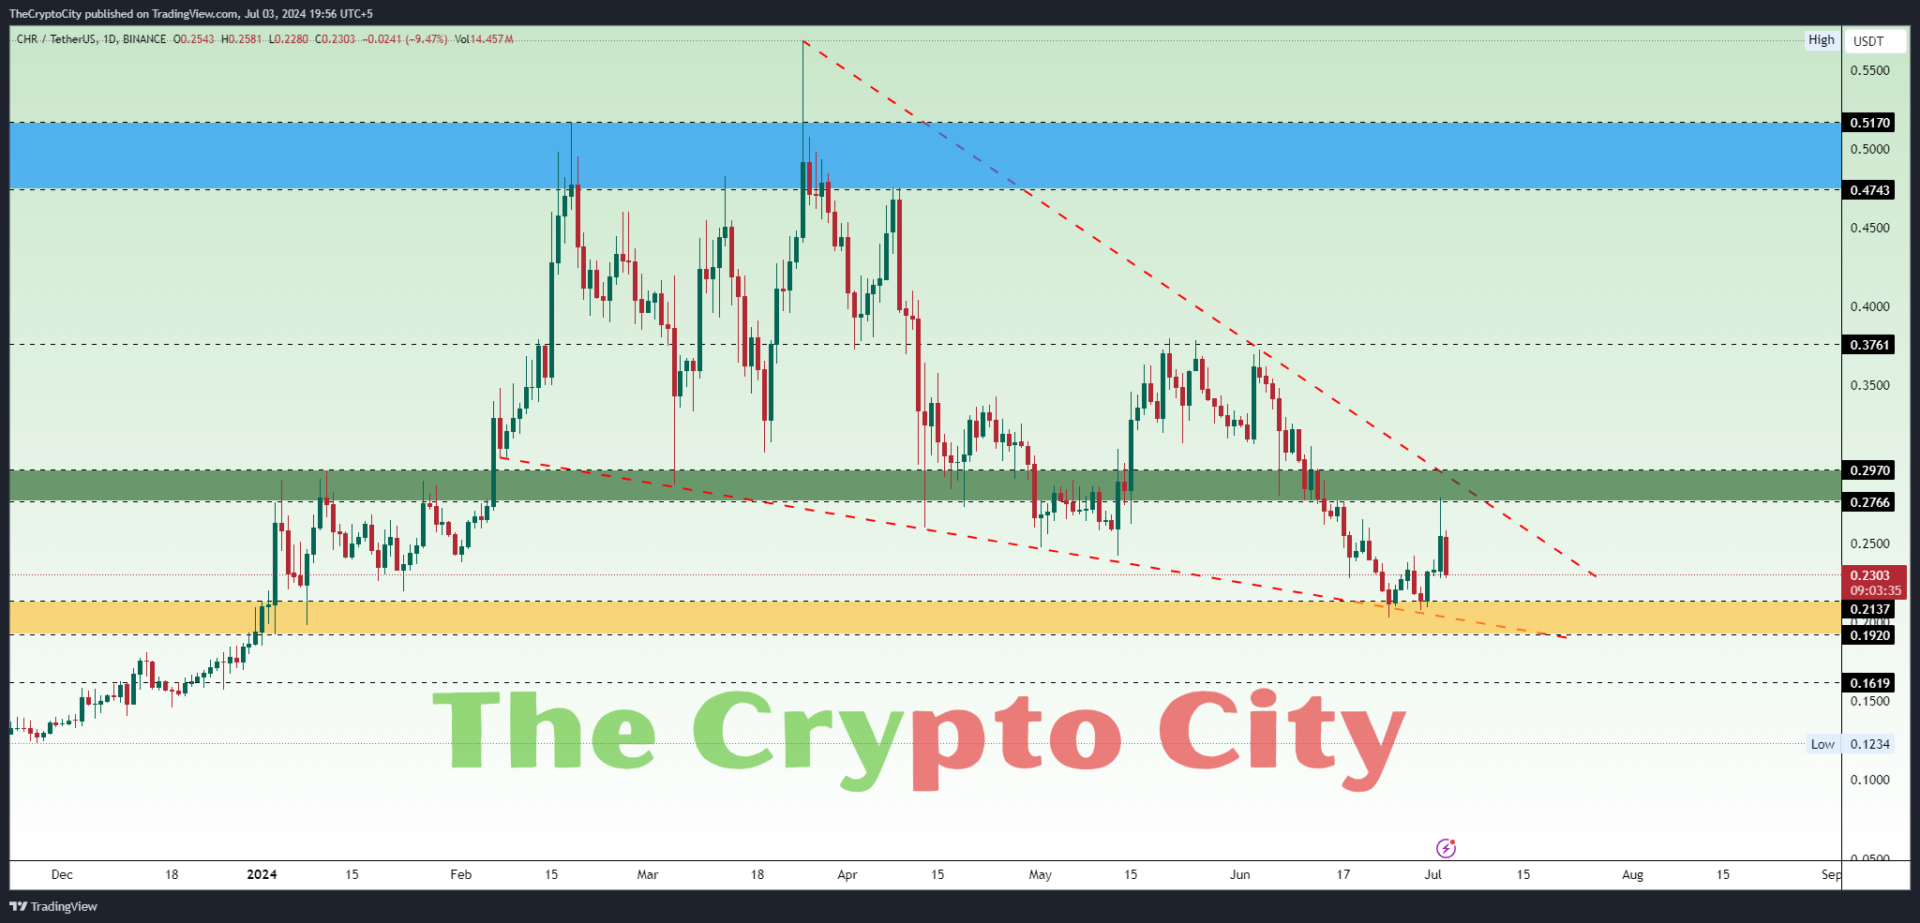
CHR is showing signs of recovering from a support zone (Yellow) at $0.1920 – $0.2137, indicating a possible upward move. Recently the price is rejected from the resistance zone (Green) at $0.2766 – $0.2970.
The price of CHR has been trading in a falling wedge pattern for approximately 147 days and bounced from the lower trend line of the falling wedge. In the past, the price has consistently bounced back when it hit the support trendline.
If the price successfully breaks above the resistance zone (Green) at $0.2766 – $0.2970 and the trend line, it could trigger a bullish trend with increased chances of reaching higher resistance levels at $0.3761 and if the momentum continues it could reach the next resistance zone (Blue) at $0.4743 – $0.5170.
If the price fails to hold the support zone (Yellow) at $0.1920 – $0.2346 and the trend line, the price could drop further below it, invalidating the bullish outlook.

