Solana (SOL) Price Analysis: Maintaining Strong Support at $100
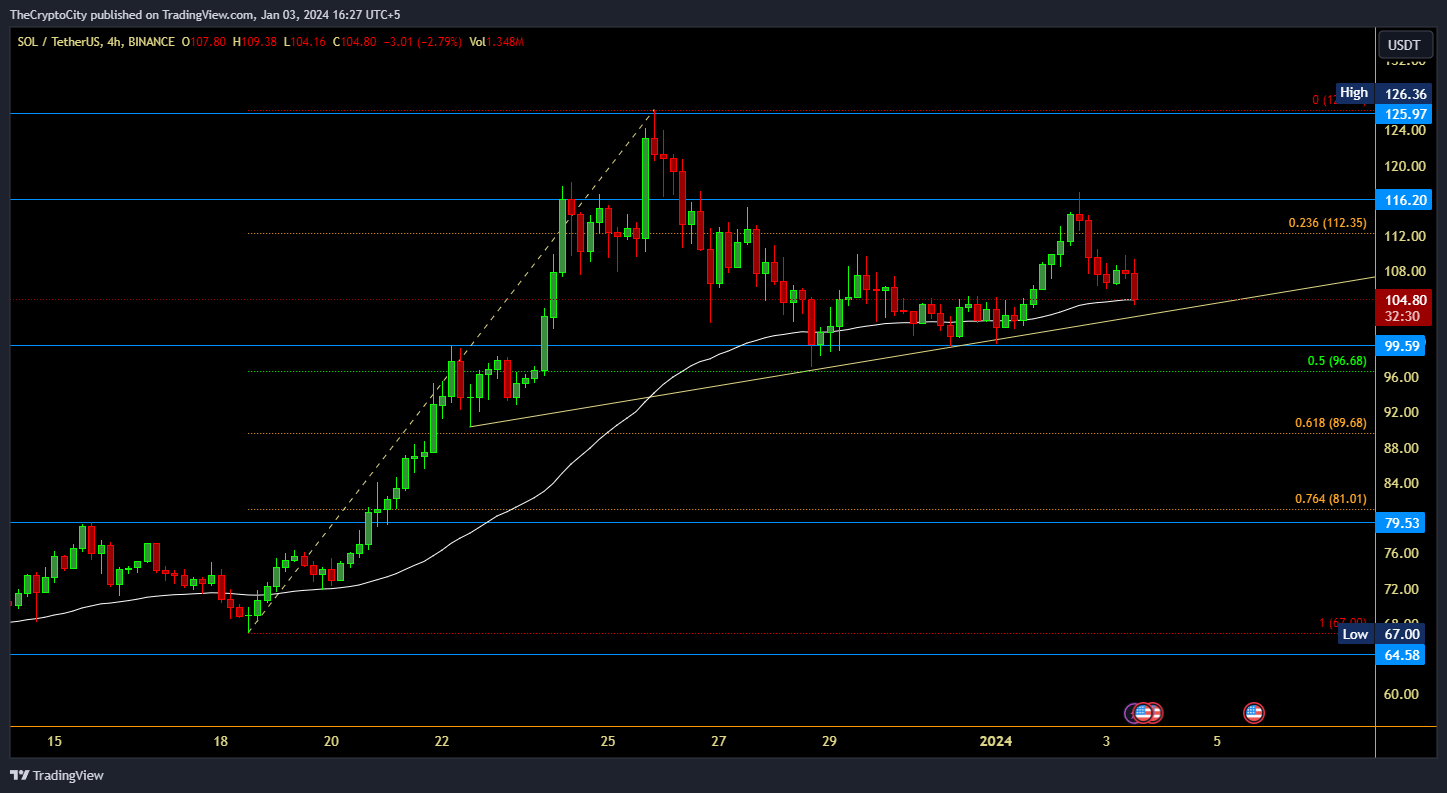
Solana witnessed a corrective retreat from the $125 region against the US Dollar, now consolidating above $105 and the 55 simple moving average (4 hours). The 4-hour chart of the SOL/USDT pair from Binance reveals a crucial bullish trend line forming with support around $103.

For the bullish momentum to persist, it’s imperative that SOL maintains levels above the $104 and $100 support thresholds. Despite a previous attempt to breach the $100 resistance zone and touch $125.97, a downside correction followed. The price dipped below the $116.20 support, breaking the 23.6% Fib retracement level from the $67.00 swing low to the $126.36 high.
Currently trading at $105.82 and the 55 simple moving average (4 hours), SOL faces initial support at the $103 level. The chart indicates a pivotal bullish trend line near $103, offering additional support. Further down, substantial support is evident around $100 and $95, aligning closely with the 50% Fib retracement level.

A breach below the critical $100 support could trigger a sharp downturn, potentially leading to a test of the $79 level, and further losses might extend to $64. On the upside, immediate resistance stands at $116.20, with major hurdles at $125 and $140. A breakthrough above these levels could propel SOL towards the $150 resistance, marking a significant uptrend.
In summary, Solana’s current trading position is above $100, and the 55 simple moving average (4 hours) sets the stage for potential upward movement, contingent on maintaining support levels at $103 and $100. Traders will be closely monitoring the price action for any signals of a renewed bullish rally or a more extended corrective phase.

