Bitcoin Faces Mounting Pressure Below Key Cost Bases
Bitcoin has pulled back from its all-time high of $124,500 to around $110,000, dropping below several important cost bases identified by on-chain analytics. This shift has left many short-term investors sitting on unrealized losses, creating a more cautious trading environment. The correction also signals that market momentum has weakened after the recent surge, with sentiment now leaning toward uncertainty.
In this context, any recovery attempt may run into resistance as short-term holders could sell at break-even levels, adding pressure to the upside. While long-term investors remain relatively stable and confident in Bitcoin’s broader trend, the short-term outlook appears fragile. Traders and analysts are closely watching whether Bitcoin can reclaim critical support levels or if further downside movement is on the horizon.
Why the cost basis stack matters
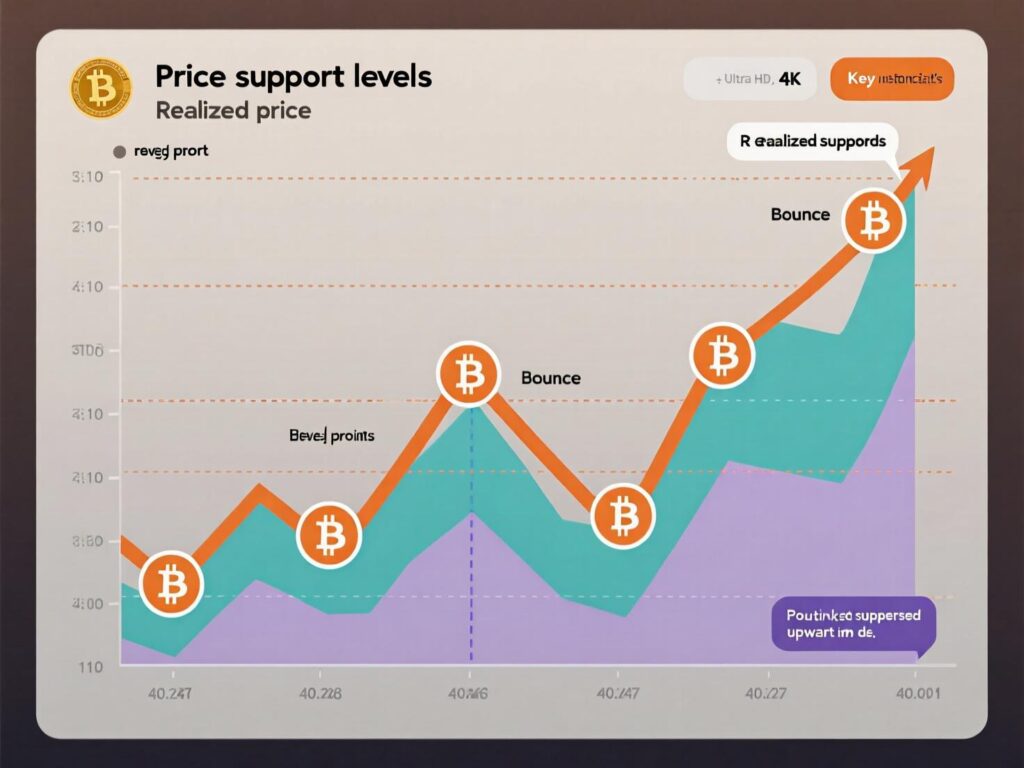
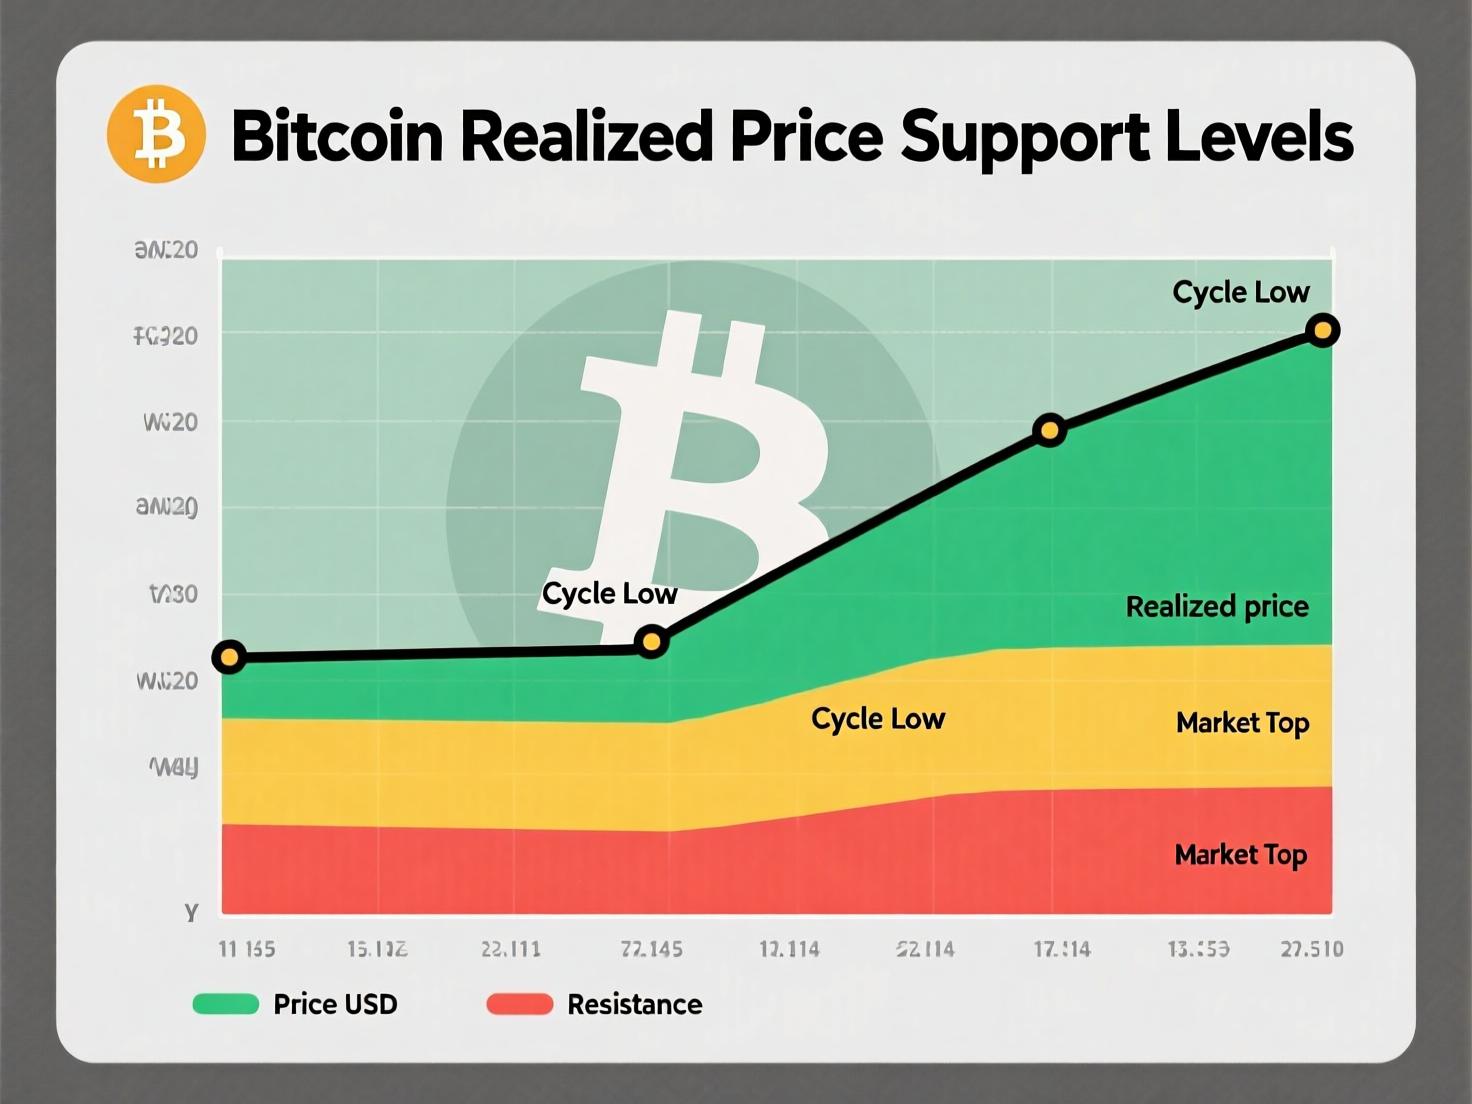
Realized price estimates the average price paid for coins within a cohort or timeframe. When spot trades below those anchors, underwater holders often sell into strength—blunting rallies. That’s why bitcoin realized price support levels are closely watched: they map where sentiment can shift from anxiety to relief.
The current on-chain picture (as of Aug. 29, 2025)
1-month realized price: ~$115,300 — now overhead resistance after BTC’s breakdown.
3-month realized price: ~$113,700 — another near-term supply zone if price bounces.
6-month realized price: $107,440 — acting as first major support on deeper dips.
STH (short-term holders) realized price: ~$108,500 — level that sparked a rebound on Aug. 26.
All 2025 buyers’ realized price: just over $100,000 — a psychological guardrail if volatility expands.
Collectively, these bitcoin realized price support levels concentrate between ~$108,500 and ~$107,440, forming a high-interest band where dip demand may appear but where failed holds could accelerate downside.

Psychology in play: relief sellers vs. patient buyers
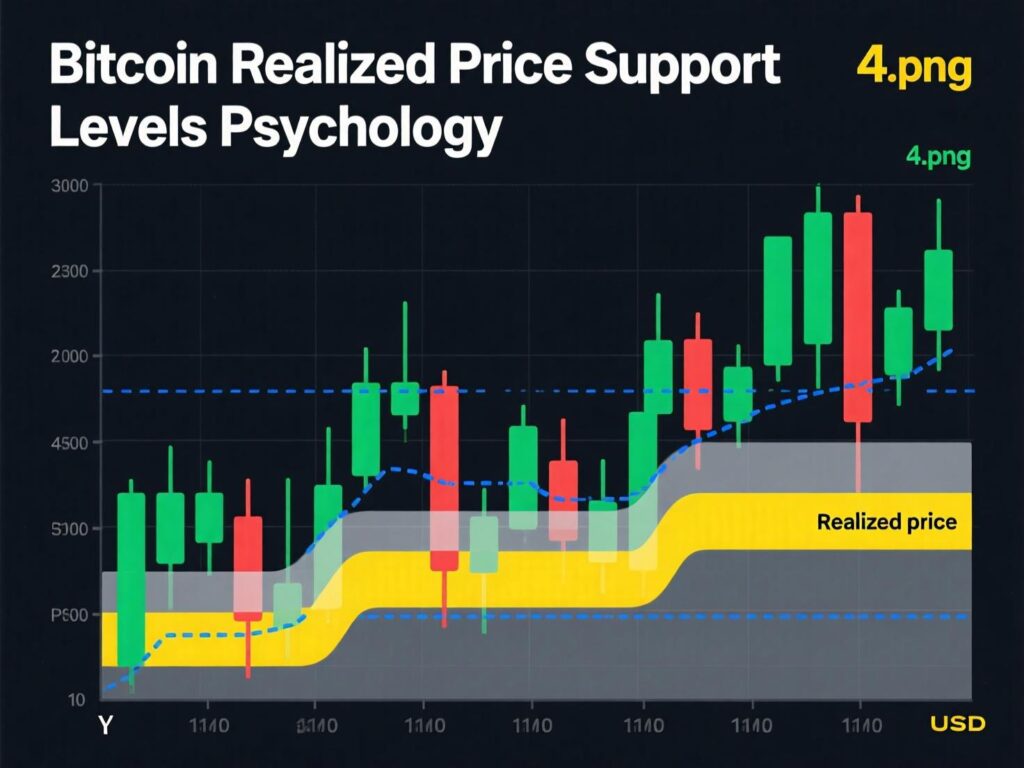
Short-term holders who bought the top region are primed to sell near cost to “get out even.” That dynamic can cap relief rallies at the 1- and 3-month bands. Meanwhile, swing and long-term participants tend to reload at deeper discounts, often around the 6-month anchor. The tug-of-war across bitcoin realized price support levels helps explain choppy ranges and quick reversals.
Two near-term scenarios
Base-building above $107,440:
If buyers defend the 6-month anchor, BTC can churn sideways, absorbing supply from short-term cohorts. Reclaims of ~$113.7K–$115.3K would indicate improving risk appetite and fewer break-even sellers.Slip toward ~$100K:
A decisive break of $108.5K/$107.44K opens a path to the 2025 buyer base just above $100K. That zone is both mathematically important and psychologically magnetic within bitcoin realized price support levels.
Macro calendar: a catalyst for volatility
Traders are also eyeing U.S. inflation prints that could sway rate-cut expectations. A hotter-than-expected core PCE would generally tighten financial conditions—historically a headwind for risk assets—potentially retesting bitcoin realized price support levels. A cooler print could ease pressure and aid reclaim attempts of the 1- and 3-month bands.
How to navigate the range
Respect the bands: Treat $108.5K–$107.44K as a pivot. Sustained acceptance above favors range recovery; firm rejection risks continuation lower.
Watch supply reactions: Fading momentum near $113.7K–$115.3K implies relief selling persists at those bitcoin realized price support levels now turned resistance.
Mind liquidity: Thin weekend books and news catalysts can overshoot targets on both sides.

Bottom line
Bitcoin continues to trade in correction mode, with its price action closely following realized price support levels. For the market to show signs of recovery, it needs to reclaim the 1- and 3-month realized price bands, which currently act as key resistance zones. Until that happens, upward moves risk being short-lived as sellers look to exit on rallies.
If the 6-month realized price anchor fails to hold, the correction could deepen further. In that scenario, the $100,000 level becomes the next critical zone to watch, potentially marking an important psychological and technical support area.
FAQs
Q1. What are bitcoin realized price support levels and why do they matter?
A . They’re cohort cost bases where buyers last transacted; when BTC trades below them, sentiment weakens and bitcoin realized price support levels can dictate bounce or breakdown zones.
Q2 . Which bitcoin realized price support levels are most important right now?
A . The $108.5K STH anchor and the $107.44K 6-month level; hold them, and sellers tire—lose them, and the $100K region within bitcoin realized price support levels comes into view.
Q3 . How do rallies behave around bitcoin realized price support levels?
A . Relief bounces often stall near recent buyer cost bases, as traders sell at break-even; reclaiming those bitcoin realized price support levels signals improving risk appetite.
Q4 . Can macro data override bitcoin realized price support levels?
A . Yes, surprises in inflation or rates can spark moves that slice through bitcoin realized price support levels, but acceptance after the spike still decides trend direction.


