This Content Is Only For Subscribers
Detailed ALICE/USDT Technical Analysis
Identifying Key Breakout and Breakdown Zones
Welcome back to another edition of The Crypto City Trading Newsletter, your go-to source for in-depth technical analysis and expert insights into the dynamic world of cryptocurrency trading. Today we are focusing on the Daily price action of ALICE/USDT.
We also provide multiple trading setups in our limited-time free premium discord server, you can take great benefit from it,
Join us and reach your financial freedom.
Our Discord Link (https://discord.gg/pYWa2cJC8E)
Today’s analysis focuses on the ALICE/USDT daily chart, highlighting key technical levels and patterns that indicate the current market sentiment and potential future price movements. The chart illustrates a significant bearish trend with the price currently testing a critical support level. This analysis aims to provide traders with actionable insights to navigate the market effectively.
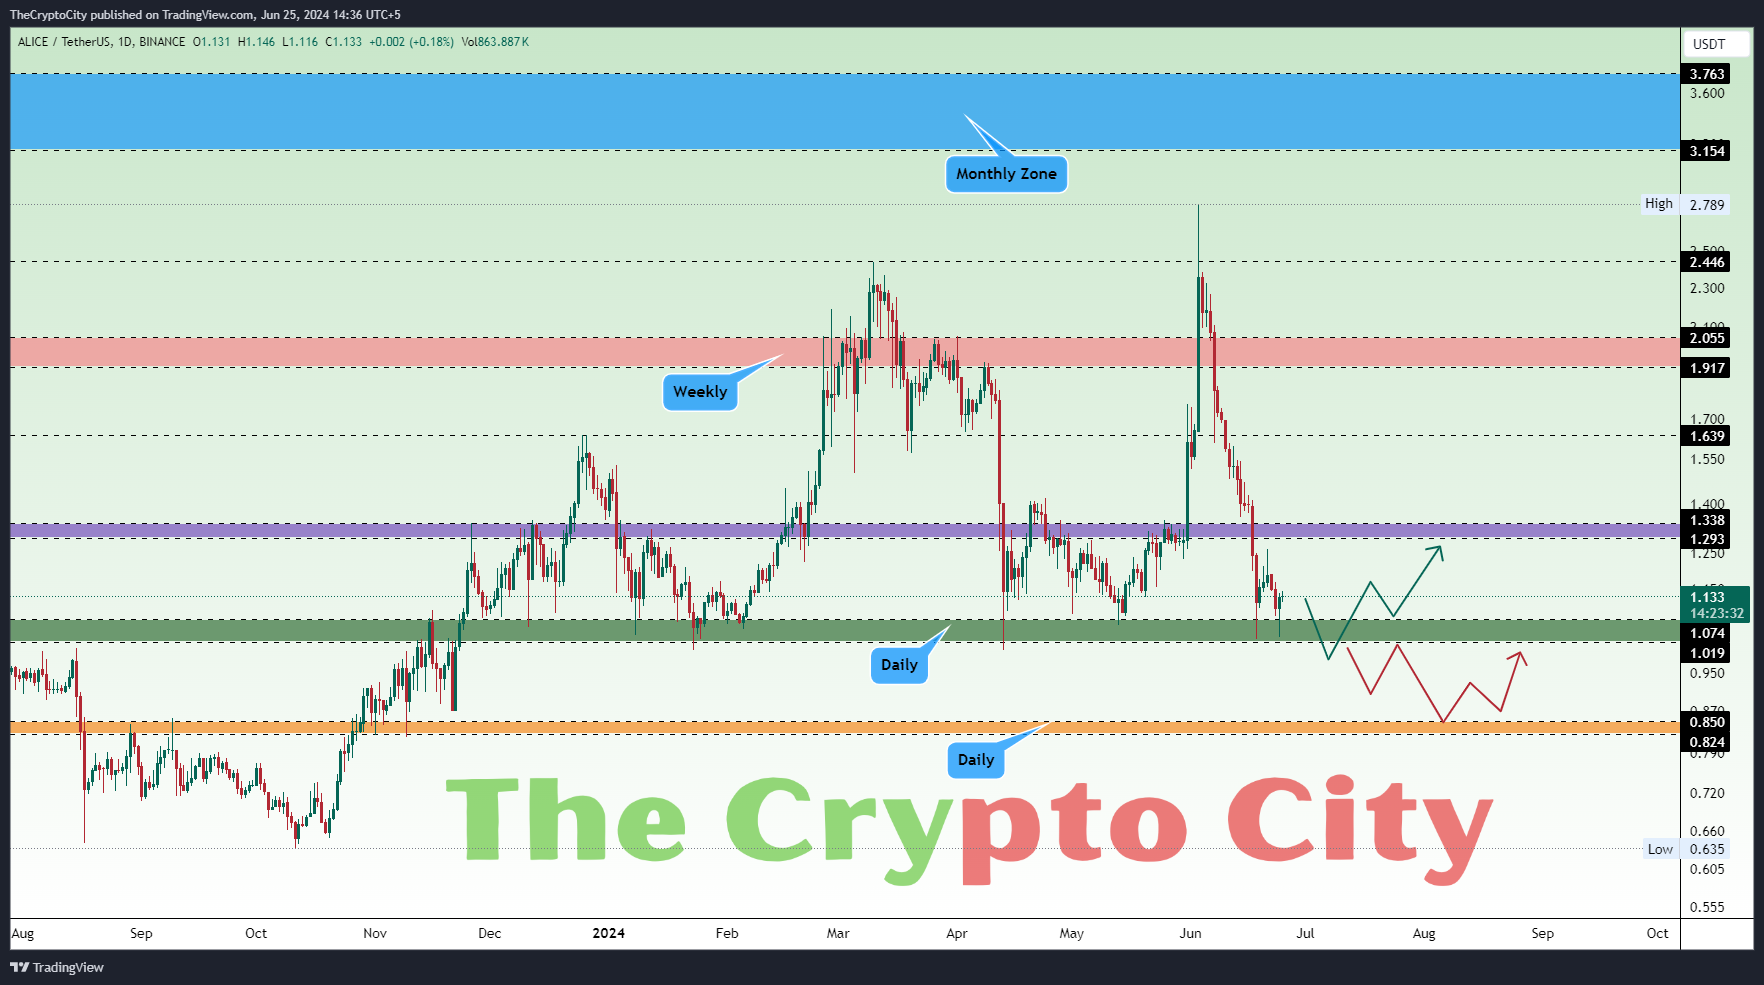
The ALICE/USDT daily chart presents a clear picture of the current bearish sentiment in the market, currently, it is trading at $1.124, just above a crucial support zone. The immediate support zone green at $1.019 to $1.074, has shown significant buying interest. The price has bounced back from this zone many times previously, the next hurdle stands at the purple zone $1.293 – $1.338. A confirmed break above this zone could take the prices to the next weekly zone pink at $1.917 – $2.055.
Sustained bullish momentum after flipping the Pink zone price could further aim for the monthly resistance zone(Blue) of $3.154 to $3.400. Conversely, a bearish scenario would see the price failing to hold the support zone(Green) at $1.019 to $1.074, leading to a decline towards the lower daily support zone(Yellow) at $0.824 to $0.850. A break below this level could result in additional downward pressure, possibly testing historical lows around $0.635. But we are hoping the price will bounce back from the green zone to the next zones that are marked on the chart after grabbing some liquidity.
The trading volume is 844.533K, which is moderate. For big price changes to happen, the volume will need to increase a lot. Therefore, watching for sudden increases in trading volume is important to confirm major price moves up or down.
The overall market conditions also play a significant role. The prevailing bearish sentiment in the cryptocurrency market, driven by factors like token unlocks and venture capital sell-offs, has a more pronounced impact on smaller altcoins compared to major cryptocurrencies like Bitcoin and Ethereum. Furthermore, stagnant liquidity inflows and reduced trading activity in stablecoins indicate a lack of fresh capital entering the market, which is essential for driving prices higher.
Technical Indicators
Based on technical indicators on a daily time frame
- The relative Strength Index (RSI) value is at 36.160 (Neutral)
- Momentum (10) is at -0.273 signaling a (Sell)
- MACD Level (12, 26) is at -0.111 signaling (Sell)
- Exponential Moving Average (50): 1.392 (Sell)
- Exponential Moving Average (100): 1.421 (Sell)
- Simple Moving Average (100): 1.465 (Sell)
- Exponential Moving Average (200): 1.390 (Buy)
- Ichimoku Base Line (9, 26, 52, 26): 1.908 (Neutral)
- Volume Weighted Moving Average (20): 1.475 (Sell)
- Hull Moving Average (9): 1.110 (Buy)
Interpretation

The technical indicators for ALICE suggest a predominantly bearish outlook, particularly emphasized by the strong sell signals from the moving averages. Most oscillators remain neutral, but there are a few indicating bearish momentum. Investors should exercise caution and consider the strong sell signals before making trading decisions.
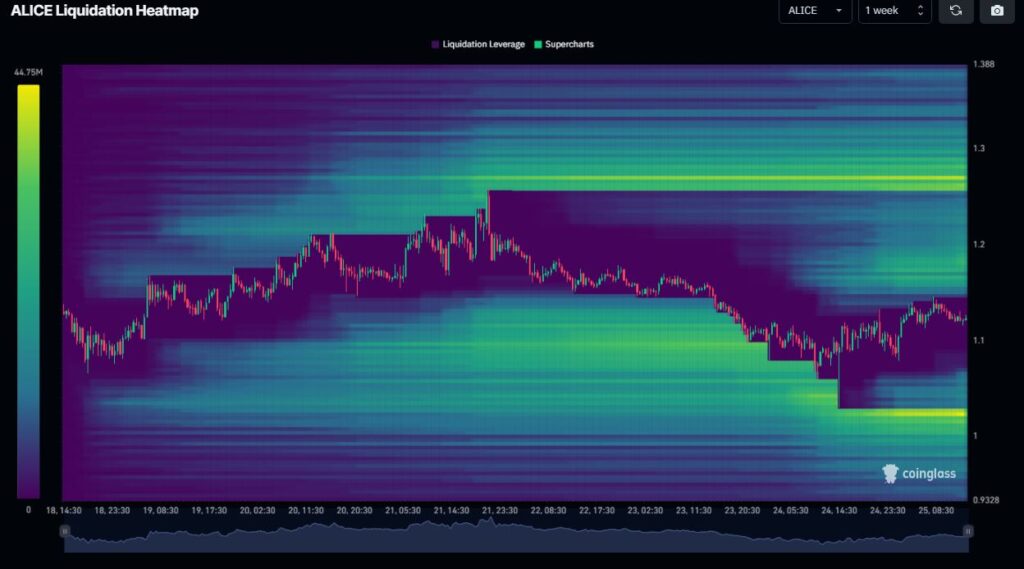
Liquidation Heatmap

Conclusion
ALICE daily chart shows bearish sentiment near $1.019-$1.074 support. Break above $1.293-$1.338 could push to $1.917-$2.055 and $3.154-$3.400. Below support, potential decline to $0.824-$0.850 or lows near $0.635. Moderate volume at 844.533K requires a significant increase for major moves. Most technical indicators lean bearish with sell signals and neutral oscillators.
Your Essential Trading Newsletter
This detailed analysis provides a comprehensive understanding of the current market structure and potential scenarios. Traders can use these insights to make informed decisions and effectively navigate the market.
Stay tuned to The Crypto City Trading Newsletter for more in-depth analyses, market insights, and expert guidance. As always, we strive to empower you with the knowledge and tools needed to navigate the fast-paced world of cryptocurrency trading. Happy trading!
Thank you for being a valued subscriber. We hope you find our insights helpful and informative. For more detailed analysis and updates, visit our website or follow us on social media.
Warm regards,

