Is Bitcoin Volatility Vacation Over? Chart Suggests So, Analysts Cite 3 Catalysts
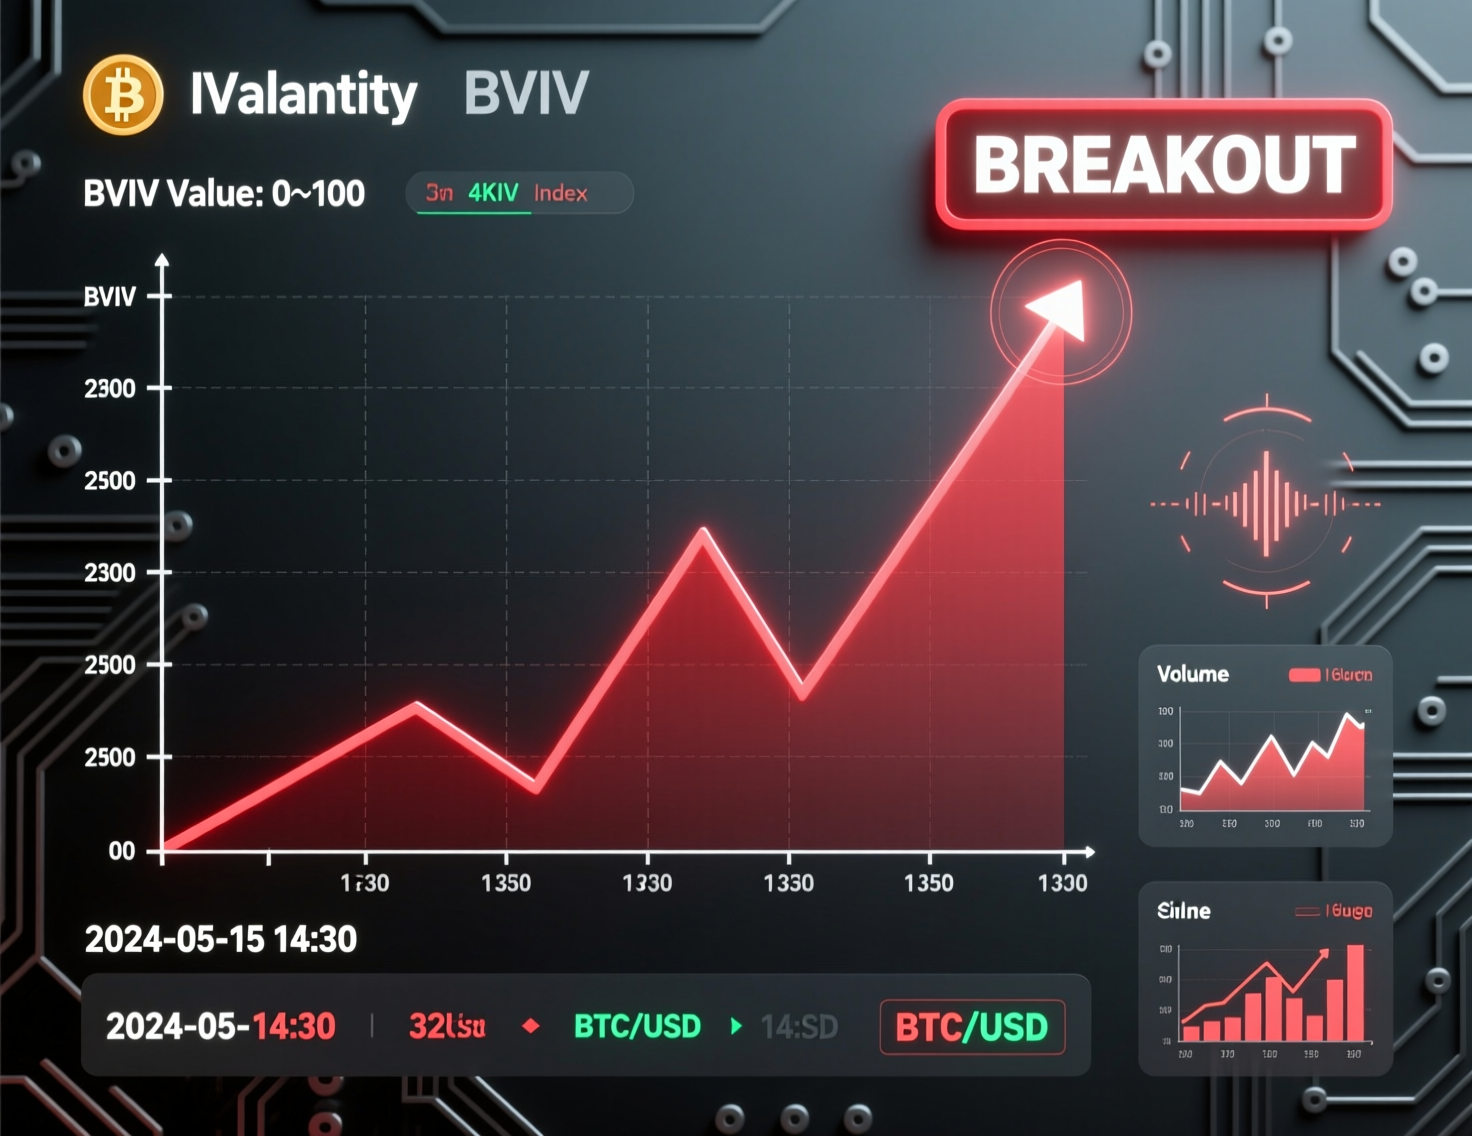
After a relatively quiet period in 2025, the Bitcoin volatility index (BVIV) has broken above a long-standing downtrend, signaling a potential shift from stable to more turbulent market conditions. Analysts note that this breakout may mark the start of a new regime characterized by heightened price swings, drawing the attention of traders seeking to adjust their strategies to a choppier environment.
Options market participants point to several factors supporting sustained volatility. Reduced supply of call overwriting, stronger demand for downside protection, and fragile liquidity conditions are likely keeping volatility elevated. Together, these dynamics suggest that Bitcoin could experience more pronounced price movements in the near term, with traders and market-structure observers watching closely for further signs of market instability.
Why the Bitcoin volatility index BVIV matters now
Volmex’s BVIV tracks the market’s 30-day expected volatility for BTC via options pricing. A decisive move above trendline resistance suggests the options market is repricing future swings higher, often preceding wider spot ranges and sharper intraday moves. Live BVIV dashboards and charts corroborate the breakout. CoinDesk
Reading the Bitcoin volatility index BVIV with price action
Context
Following the Oct. 10–11 drawdown when BTC fell ~14% to ~$104,783 from >$122,000 liquidity and market depth thinned, amplifying the impact of large orders.
Implication
Rising implied vol alongside fragile depth implies wider realized ranges ahead even without a directional trend.

Catalysts behind the BVIV breakout
Fewer “natural” volatility sellers
Throughout 2025, miners, OG holders, and whales frequently sold covered calls, suppressing implied volatility. After the October shock, those players stepped back, reducing short-vol supply.
Stronger demand for downside hedges
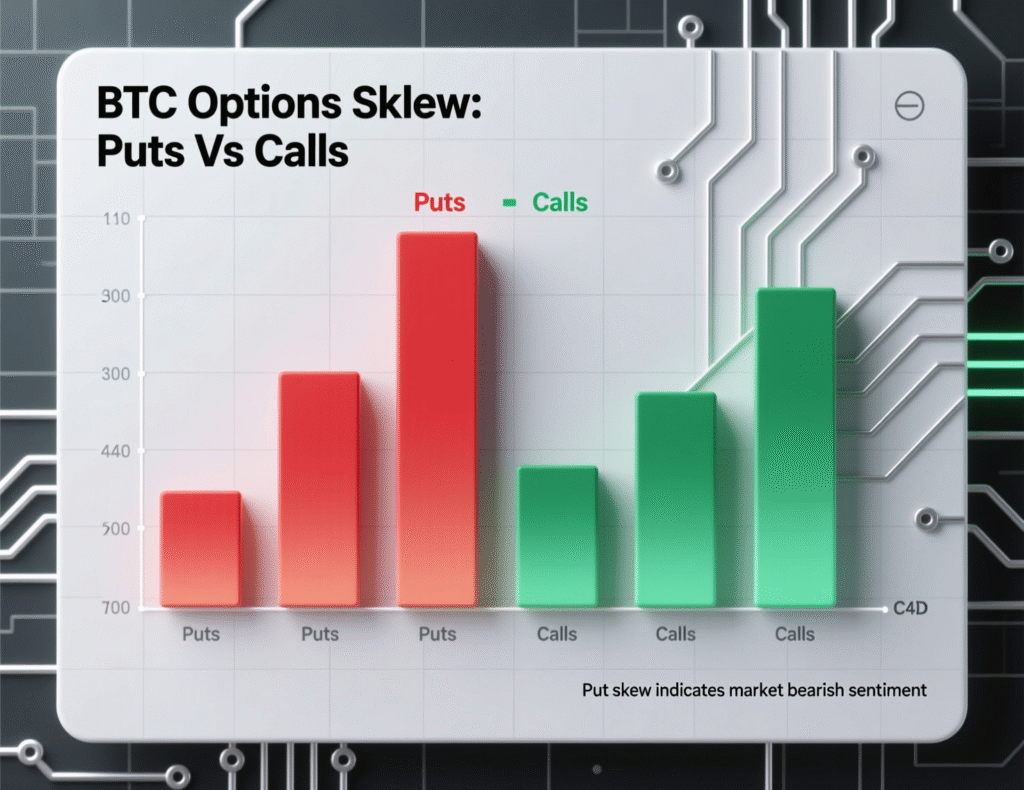
Institutional desks are buying out-of-the-money puts (sub-$100K strikes), lifting put skew and overall IV. CoinDesk cites Orbit Markets’ Jimmy Yang describing a shift from call-selling in uptrends to renewed put demand as spot softened.
Thin liquidity magnifies moves
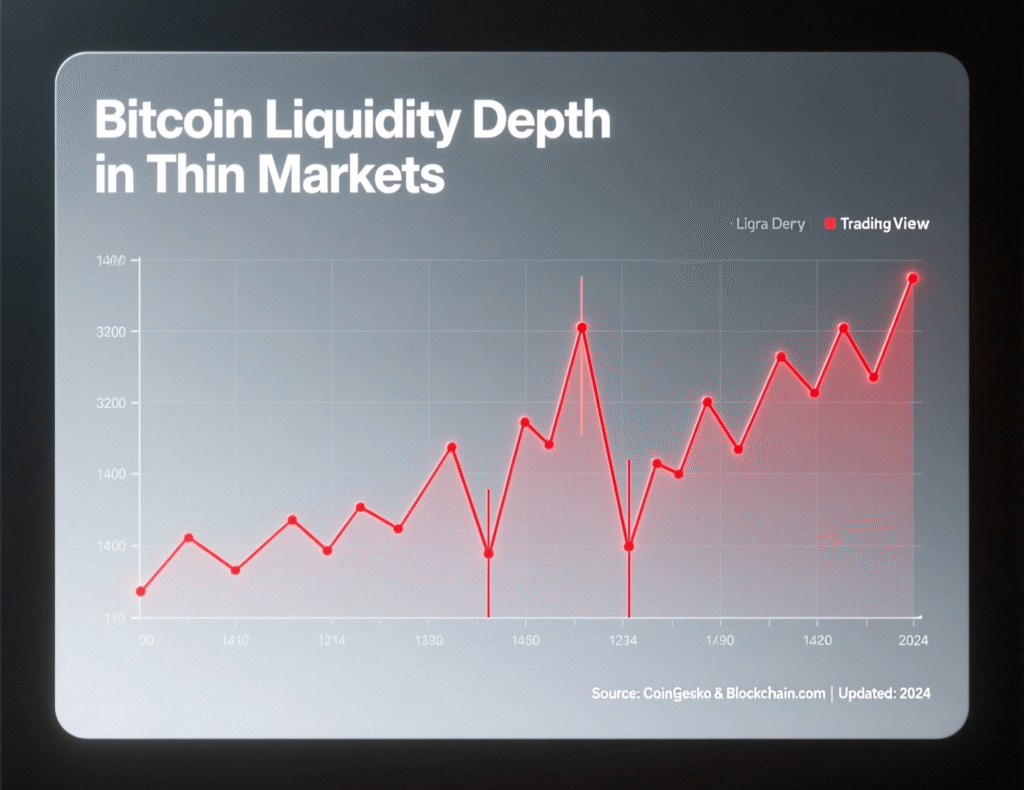
Post-crash market depth remains shallow compared with early Q4 levels, making prices more sensitive to block flows and options-related hedging. In such regimes, small catalysts can trigger outsized swings.
Context & Analysis
The BVIV breakout doesn’t guarantee a bearish or bullish spot trend only fatter tails. Historically, macro catalysts (inflation prints, central-bank decisions) can spike implied vol into the event and compress it after uncertainty clears. Traders may prefer dynamic risk controls (e.g., ATR-based stops) and scenario planning for gap risk while liquidity remains thin.

Conclusion
BVIV’s recent rise above its trend resistance, combined with shifting market flows and thinner liquidity, suggests that Bitcoin’s period of unusually low volatility is likely over. The calm that characterized earlier trading has given way to conditions favoring sharper price movements.
Traders should anticipate wider price ranges and quicker swings in the near term. Volatility may remain elevated until market depth is restored or the current demand for hedging eases. These dynamics indicate that Bitcoin is entering a more active phase, requiring careful positioning and risk management for participants navigating the choppier environment.
FAQs
Q : What is BVIV?
A : BVIV is Volmex’s 30-day Bitcoin implied volatility index derived from options pricing.
Q : Did the October crash change market dynamics?
A : Yes. BTC fell to ~$104,783 on Oct. 10–11, and liquidity thinned, increasing sensitivity to large flows.
Q : Why did volatility sellers step back?
A : After the drawdown, miners/whales reduced covered-call supply, easing pressure on implied volatility.
Q : How does the Bitcoin volatility index BVIV relate to BTC price?
A : A BVIV uptrend often coincides with wider BTC trading ranges but isn’t inherently bullish or bearish.
Q : What near-term catalysts could move BVIV?
A : Macro releases (e.g., CPI, Fed decisions) and liquidity shifts tend to move implied volatility.
Q : Is higher BVIV bad for long-term holders?
A : Not necessarily; it mainly affects short-term pricing and hedging costs.
Q : How can traders adapt to elevated vol?
A : Reduce position sizing, widen stops thoughtfully, and monitor event risk.
Facts
Event
BVIV breaks trendline; analysts cite three catalysts for higher BTC volatilityDate/Time
2025-11-12T14:00:00+05:00Entities
Volmex Labs (BVIV); Bitcoin (BTC); Orbit Markets (Jimmy Yang)Figures
BTC low ~$104,783 on Oct. 10–11 (-14% from prior high); BVIV trendline breakout (30-day implied vol)Quotes
“Typical volatility sellers… have notably stepped back… demand for downside put protection has picked up.” Jimmy Yang (via CoinDesk) CoinDeskSources
CoinDesk report (news); Reuters report (prices); Volmex/TradingView charts (BVIV)

