This Content Is Only For Subscribers
Detailed SOL Technical Analysis
Welcome back to another edition of The Crypto City Trading Newsletter, your go-to source for in-depth technical analysis and expert insights into the dynamic world of cryptocurrency trading. Today we are focusing on the Daily price action of SOL/USDT.
We also provide multiple trading setups in our limited-time free premium discord server, you can take great benefit from it,
Join us and reach your financial freedom.
Our Discord Link (https://discord.gg/pYWa2cJC8E)
Total SOL Market Cap: $68,311,882,658
Circulating Supply: 462,359,806 SOL
Total Supply: 579,084,686 SOL
Max Supply: ∞
Now moving towards the analysis.
Let’s dive deeper into the technical analysis of the SOL/USDT chart. We will analyze each aspect of the chart in greater detail, including support and resistance levels, trend lines, moving averages, and price action.
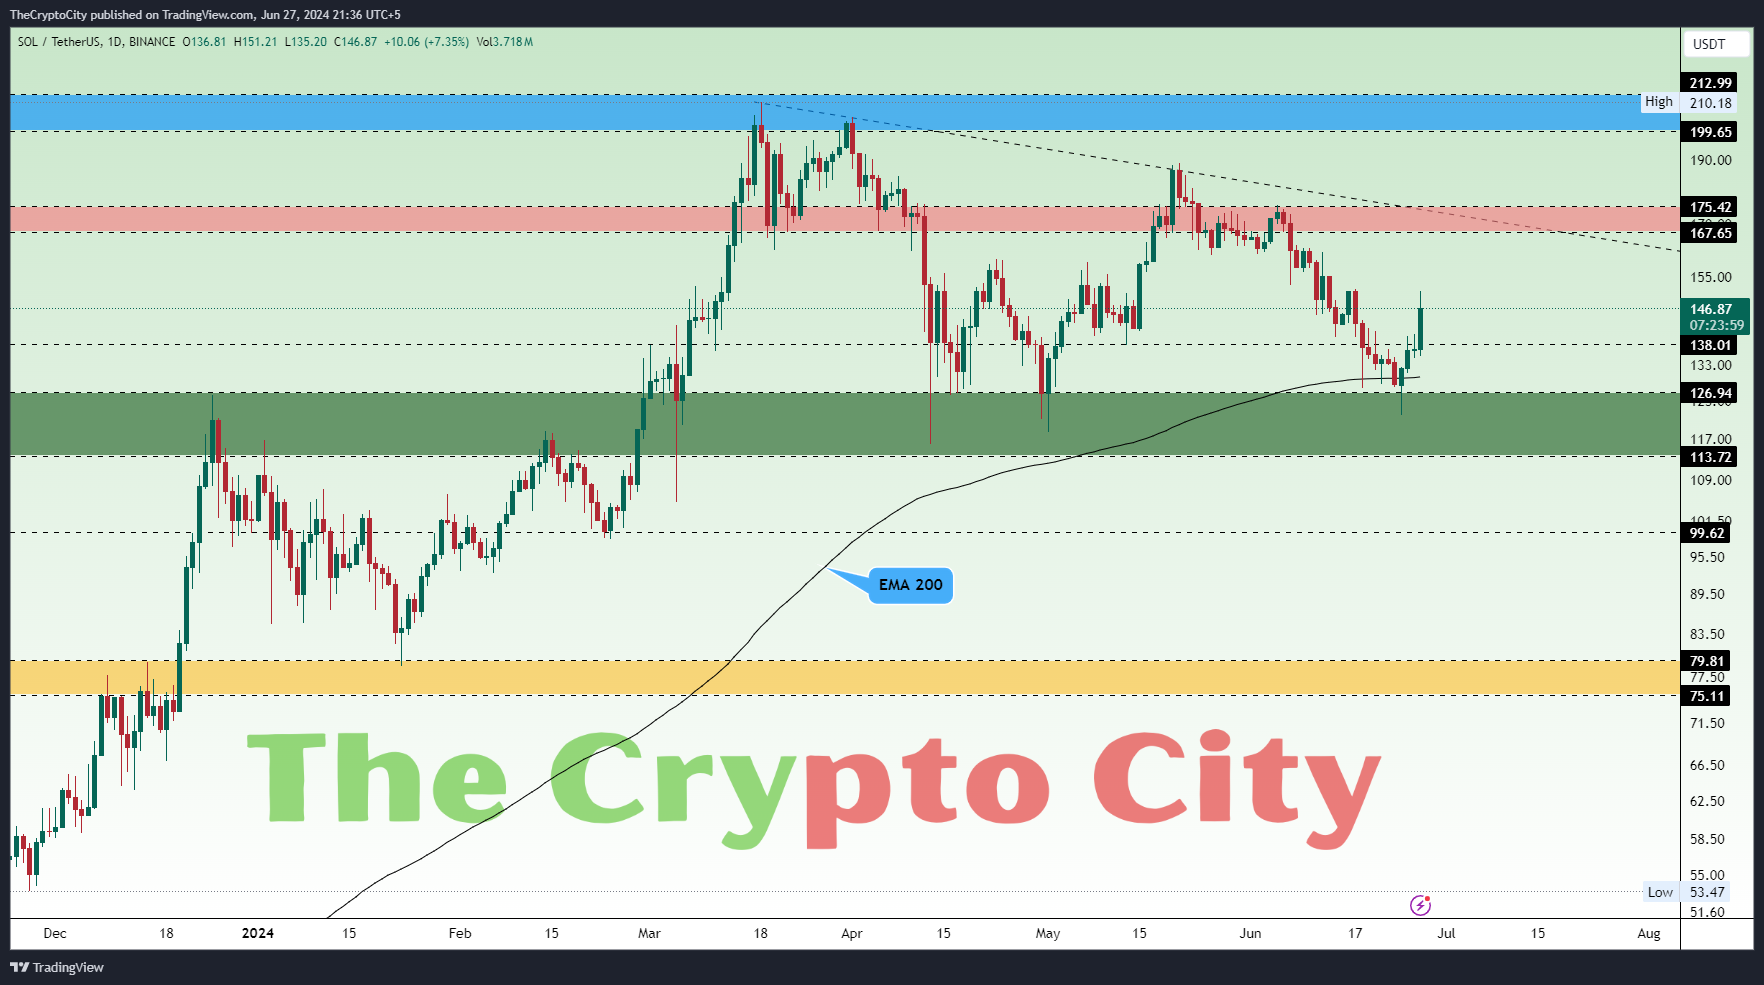
The price of SOL is currently trading at $147.76.The sol breaks its resistance level at $138.01 and now makes its support. After rejection from the trend line and resistance zone(Pink) at $167.65 – $175.42 it falls at the support zone (Green) at $113.72 – $126.94 and now bounces from here. The price has been trading on the EMA 200 (Black) is showing a bullish trend.
Support and Resistance Levels
Support and resistance levels are crucial in technical analysis as they indicate potential price reversal points.
Support Zones (Green) $113.72 – $126.94
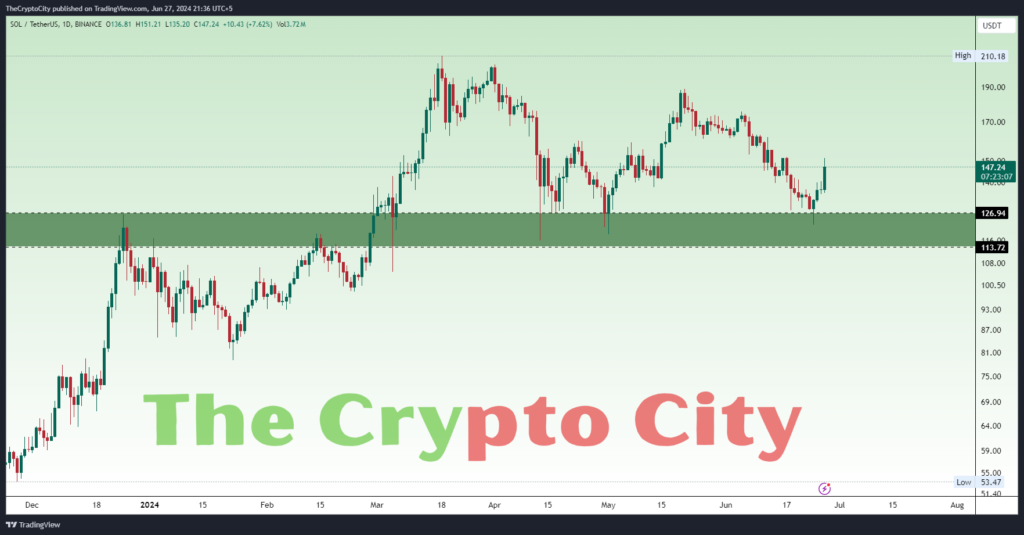
This level has previously acted as a strong support, where buyers have consistently stepped in to prevent the price from falling further.
Support Level at $99.62
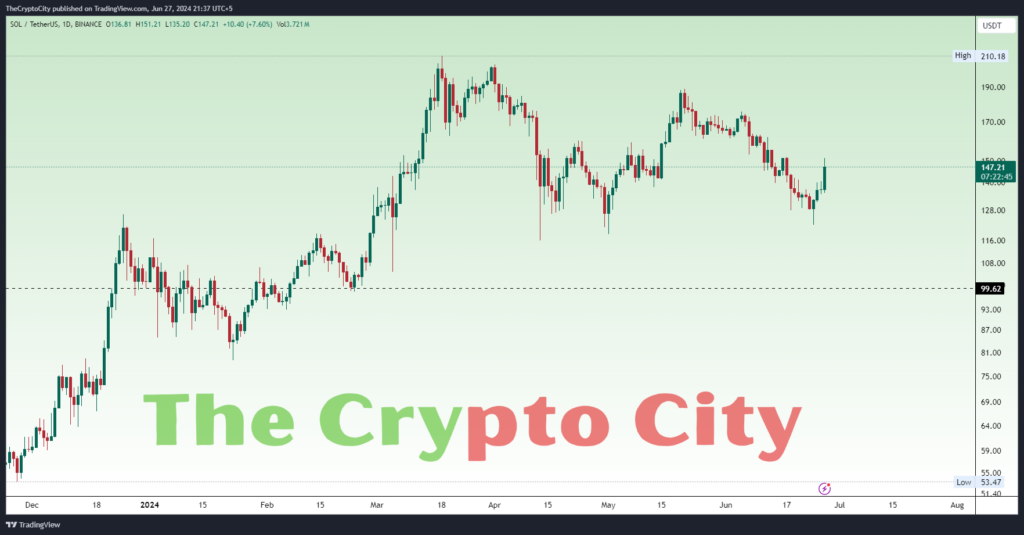
This is another critical level where buying pressure might re-emerge if the price falls below the major support.
Support Zone (Yellow) at $75.11 – $79.81
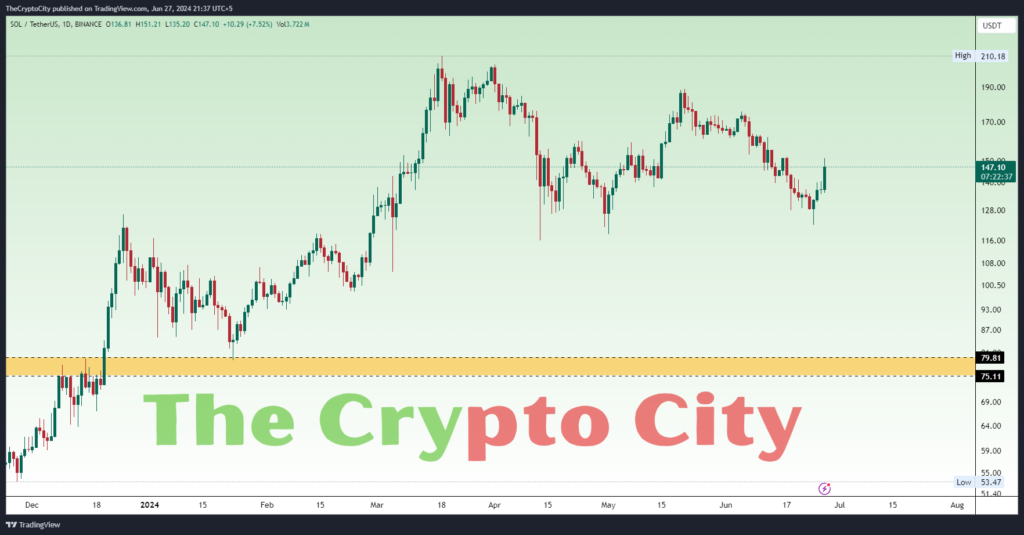
This yellow zone represents a strong support area, providing a cushion if the price experiences a significant decline.
Support Level at $136.32
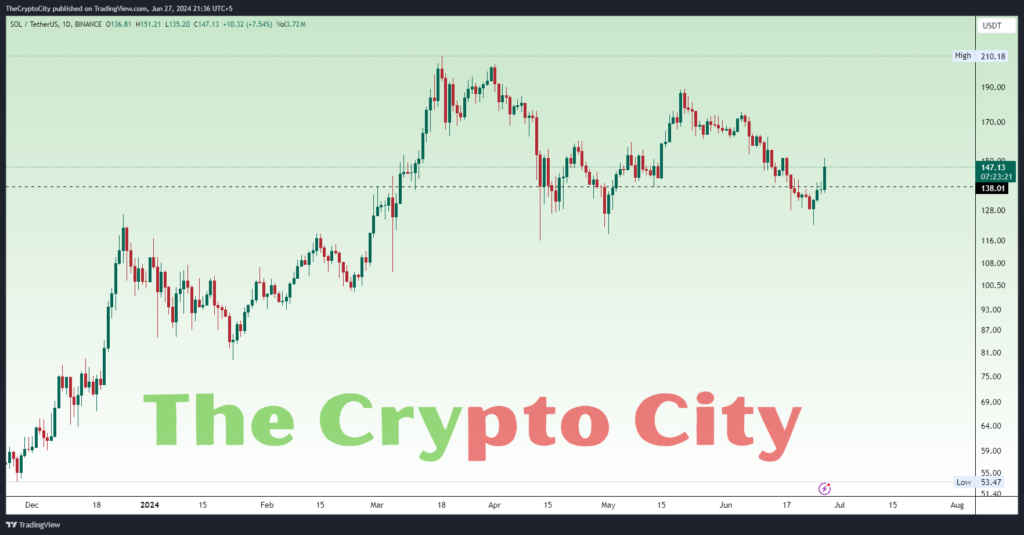
This level is the current support. The price could retest this level.
Resistance Zone (Pink) at $167.65 – $175.42
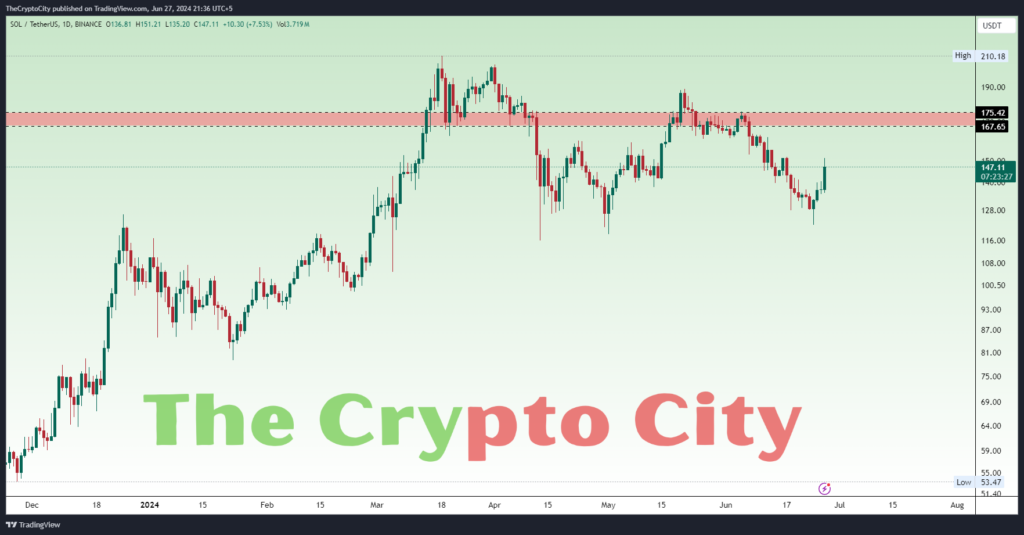
This zone indicates a significant resistance that could pose a challenge if the price moves higher.
Resistance Zone (Blue) at $199.65 – $212.99
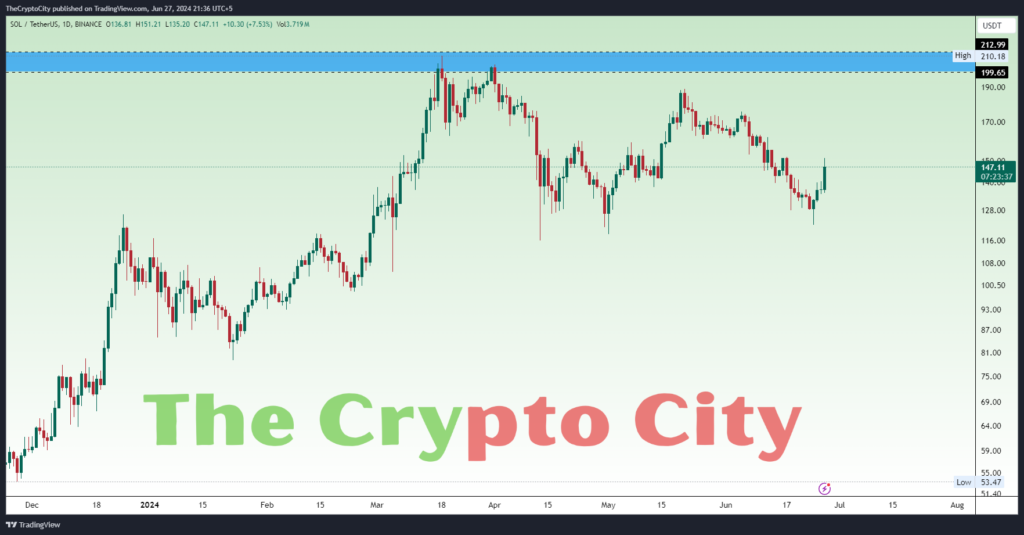
This zone marks a significant resistance area where the price previously faced strong selling pressure.
Exponential Moving Averages
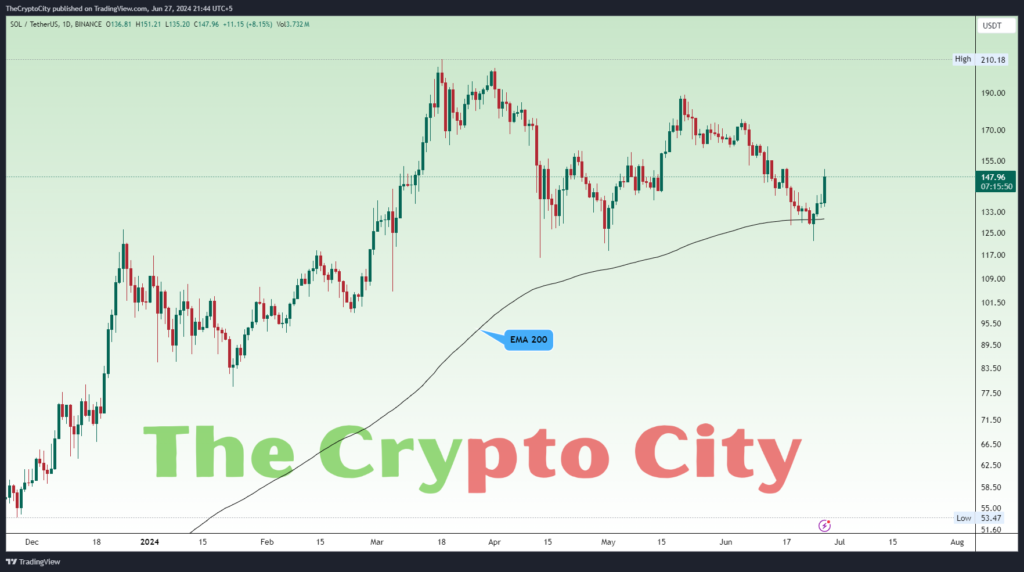
The price is currently above the 200 EMA, which is a long-term bullish signal. The 200 EMA often acts as dynamic support or resistance, and trading above it suggests that the overall trend is positive.
Descending Trend Line
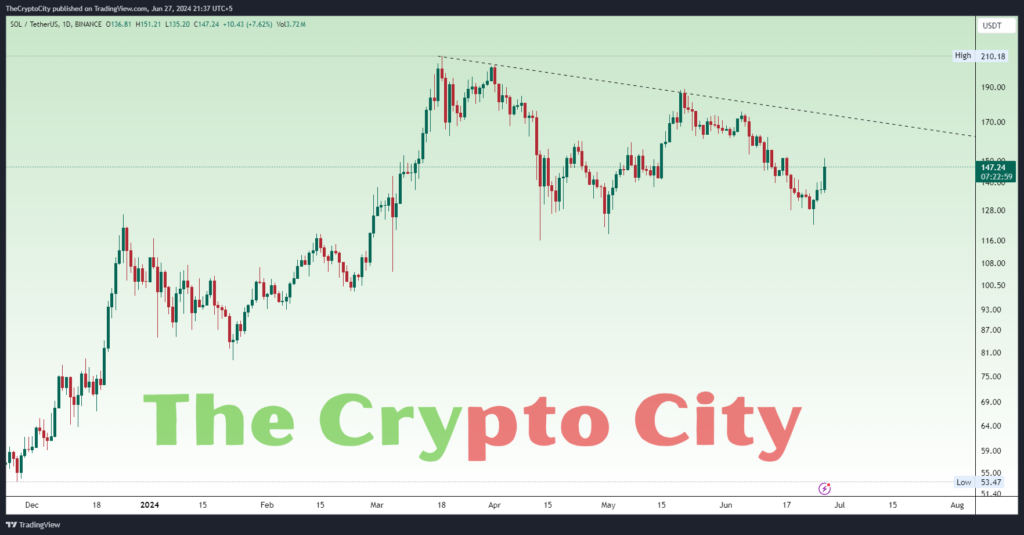
The trend line from the recent high indicates a downward slope, representing a resistance trend line. This trend line could act as resistance if the price approaches it again.
Price Action
Recent Movement
Currently, the price is trading at $147.46 at the time of writing. The price has bounced off the major support zone (Green) and EMA 200. Now the price breaks out from the $138.01 level.
Volume Analysis
At the time of writing the trading volume is at 3.622M, indicating significant trading activity and interest at the current price level.
Observations
– Currently, the price breaks the $138.01 resistance level and makes it a support.
– If the price holds above this level, it could trigger a bullish run towards the next resistance zone(Pink).
– If the price fails to hold this support, it could fall back towards the support zone(Green).
Potential Scenarios
There are 2 scenarios
Bullish Scenario
If it holds the support level at $138.01, we could see the price targeting the next zone(Pink) and the trend line.
If the bullish momentum continues and breaks above from Pink zone and the trend line, we could see the price will reach a higher resistance zone in Blue.
Bearish Scenario
If the price fails to break the 138.01 USDT resistance, it could fall back to the support zone in Green.
If the price breakdown from the major support zone Green could lead to a further decline toward the support at $99.62 and possibly it could break down further to the next support zone in Yellow. The last zone is marked on the chart.
Technical Indicators
Based on technical indicators on a daily time frame
- The relative Strength Index (RSI) value is at 51.32 (Neutral)
- Momentum is at 4.45 signaling a (Buy)
- MACD Level (12, 26) is at -6.04 signaling (Buyl)
- Exponential Moving Average (50): 150.60 (Sell)
- Exponential Moving Average (100): 148.58 (Sell)
- Simple Moving Average (100): 159 (Sell)
- Exponential Moving Average (200): 130.40 (Sell)
- Ichimoku Base Line (9, 26, 52, 26): 148.80 (Neutral)
- Volume Weighted Moving Average (20): 141.98 (Buy)
- Hull Moving Average (9): 139.71 (Buy)
Interpretation

The oscillators are neutral, and the moving averages’ strong buy signals suggest that the overall sentiment for SOL/USDT is bullish, with an expectation of upward price movement in the near term. This could be an opportune moment for traders to consider entering a buy position, while also being cautious and monitoring for any shifts in market sentiment.
Conclusion
The analysis of SOL/USDT shows a cautiously positive outlook for traders. The price is currently holding above the key support level of $138.01, which could signal a bullish trend if it stays there. The mix of support and resistance levels, along with varied signals from technical indicators, highlights the need to watch the market closely. This detailed analysis gives traders useful insights to make informed decisions.
Your Essential Trading Newsletter
This detailed analysis provides a comprehensive understanding of the current market structure and potential scenarios. Traders can use these insights to make informed decisions and effectively navigate the market.
Stay tuned to The Crypto City Trading Newsletter for more in-depth analyses, market insights, and expert guidance. As always, we strive to empower you with the knowledge and tools needed to navigate the fast-paced world of cryptocurrency trading. Happy trading!
Thank you for being a valued subscriber. We hope you find our insights helpful and informative. For more detailed analysis and updates, visit our website or follow us on social media.
Warm regards,
The Crypto City Trading Team

