OCEAN price analysis
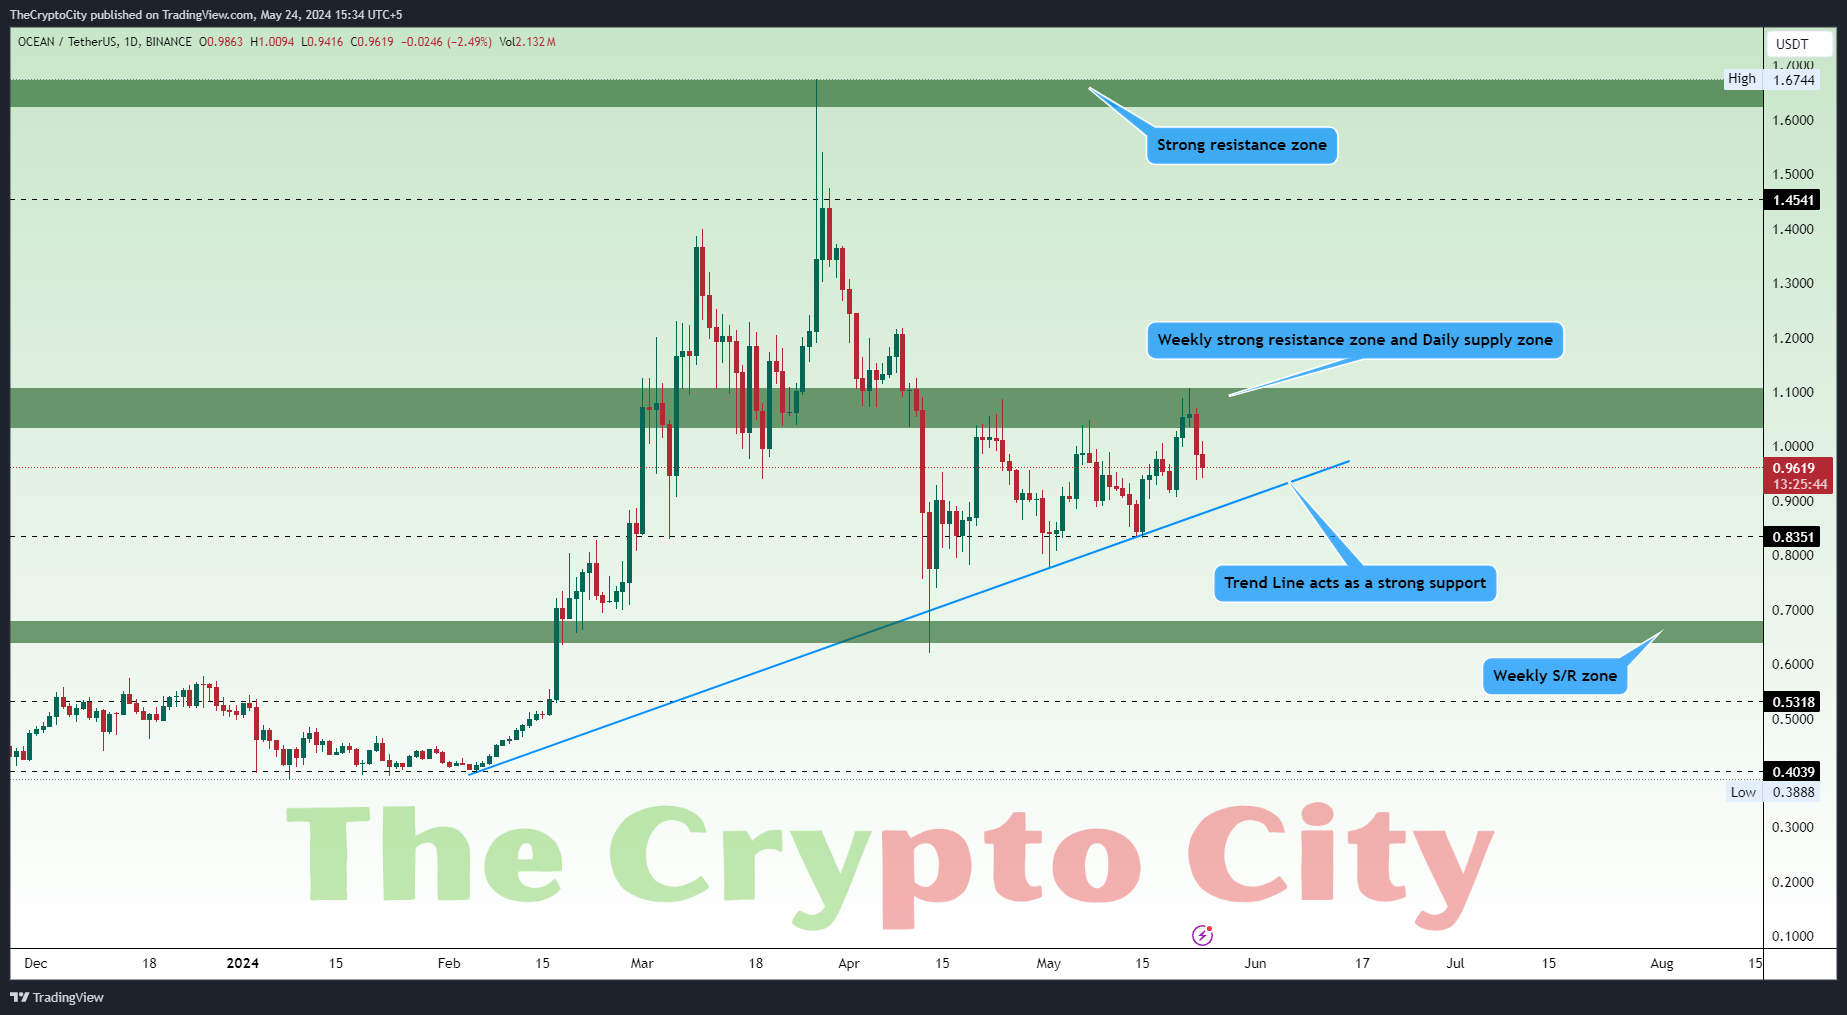
Price analysis of OCEAN (Ocean Protocol ), highlighting several key technical elements and zones that offer insight into potential future movements.
Key Technical Levels and Zones:
1. Strong Resistance Zone ($1.6216 – $1.6746)
– The strong resistance zone between approximately $1.6216 and $1.6746 has historically been a significant barrier, with the price failing to break, due to substantial selling pressure.
2. Weekly Strong Resistance Zone and Daily Supply Zone ($1.0317 – $1.088)
– This zone acts as a critical resistance area on both weekly and daily timeframes. The price has encountered consistent resistance here, making it a strong supply zone where sellers dominate. This zone is crucial for traders looking for potential reversal points or breakouts.
3. Trend Line Support
– A trend line originating from the lows around January 2024 and connecting higher lows acts as a dynamic support. The trend line is critical for maintaining the bullish momentum. If the price stays above this trend line, the bullish trend remains intact.
4. Weekly support zone ($0.6362 – $0.6815)
– This zone acts as a strong support and resistance zone on the weekly time frame previously. Many times price bounce back from this zone.
Current Price Action:
– The price is trading around $0.9644, having recently faced rejection from the $1.1088 resistance level.
– The price is consolidating, moving between the $1.1088 resistance and the trend line support.
– A recent pullback has occurred from the $1.1088 zone, and the price is approaching the trend line, which acts as a potential support level.
Potential Scenarios:
1. Bullish Scenario
– If the price holds above the trend line support and successfully breaks above the $1.1088 resistance, it could target the next resistance zone around $1.4541.
– A break above the $1.4541 zone would likely lead to a test of the strong resistance between $1.6216 and $1.6746.
2. Bearish Scenario:
– If the price breaks below the trend line support, it may drop towards the support zone between $0.6362 and $0.6815. This area is expected to provide substantial support and potentially induce a bounce.
– A failure to hold this support zone could lead to further declines, possibly towards the $0.5318 and $0.4039 final support levels.
Indicators and Patterns:
– Volume:
Observing volume spikes at key levels will help confirm breakout or breakdown scenarios. Higher volume during upward moves indicates strong buying interest, while higher volume during declines suggests stronger selling pressure.
– Candlestick Patterns:
Monitoring for bullish reversal patterns (e.g., bullish engulfing, hammer) at support levels and bearish reversal patterns (e.g., bearish engulfing, shooting star) at resistance levels can provide additional confirmation for entry and exit points.
Conclusion:
The chart depicts a market in a consolidation phase with clear support and resistance levels. The trend line support is crucial for sustaining the bullish momentum. Traders should closely watch price action near these key levels, with attention to volume and candlestick patterns to confirm potential breakouts or breakdowns. Staying above the trend line and breaking through the $1.1088 resistance could indicate further bullish potential, while failing to hold the trend line support may lead to a retest of the lower support zone.

